The platform forEnvironmental diagnosis& monitoring
Market leader of public sectorSpecifically designed to meet the needs of local territorial communities, the Meteory platform gives you access to all the environmental data and necessary tools for the establishment and monitoring of your ecological policy and your differentlocal urbanisation plans.
clients.title


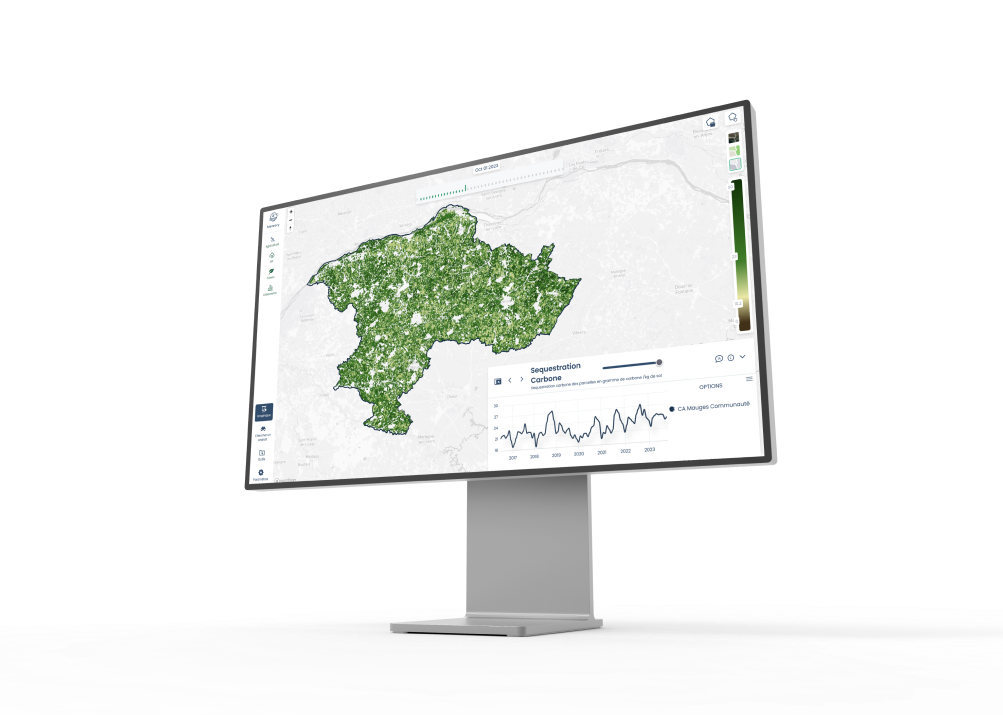
A user-friendly interface
Visualise your territory's datain a clear & precise way
Easily browse through our different indicators and quickly get an overview of your territory's situation with a simple and detailed interface. If needed, go back in time and dive into the details using the various tools provided to better understand the different trends.
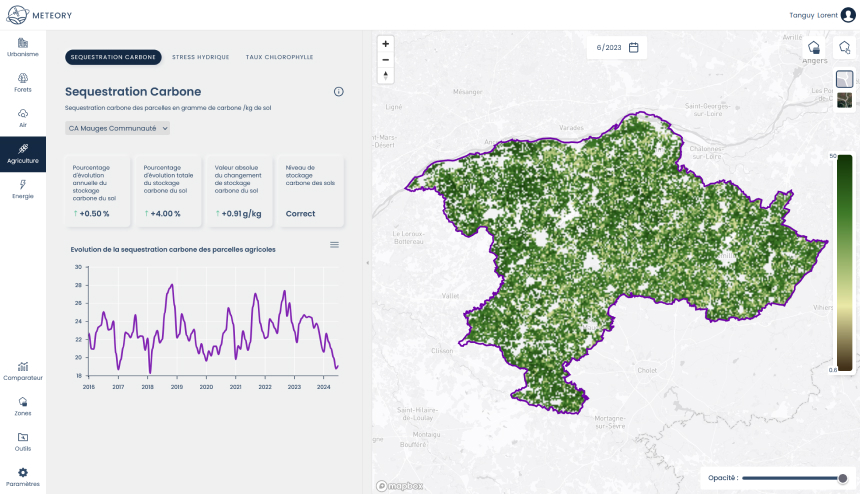
Our Datasets
Access all the datasets you needto establish your ecological policy
Explore the different datasets available on our platform, especially designed to meet your needs. From changes in land use to carbon sequestration, including measurement of linear kilometers of hedges, our wide range of datasets is here to support your decisions.
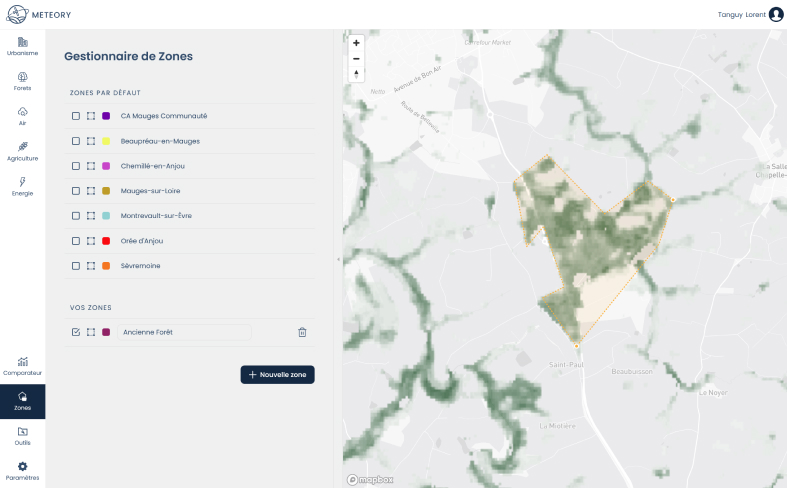
Custom areas of interest tool
Go into details by definingyour own areas of interest
In addition to the official administrative boundaries of your territory, you can also define your own areas of interest to analyze the situation in specific locations. This allows you to observe the effects of different actions on your territory and precisely measure their impact.
Comparison tools
Identify the trends of your territorywith our comparison tool
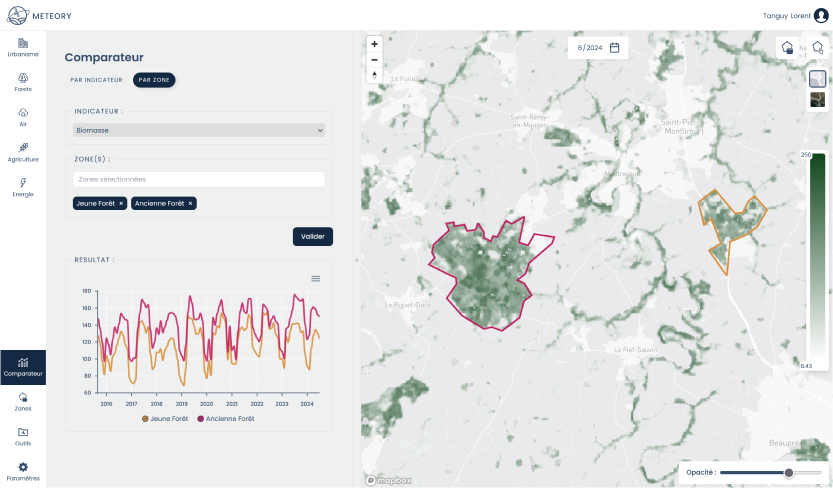
Compare different locations based on an indicator to identify your strengths and weaknesses, or correlate different indicators within the same area to identify links and trends.
subscription
Become Premium
Access all the environmental data of your territory in high resolution, as well as unlimited access to all our features.
| Your advantages | Meteory without subscription | Meteory Premium |
|---|---|---|
| Access to all datasets | ||
| Data up until today | ||
| High resolution data | ||
| Exportation of data into CSV format | ||
| Customs zones of analysis | ||
| Comparison tools |
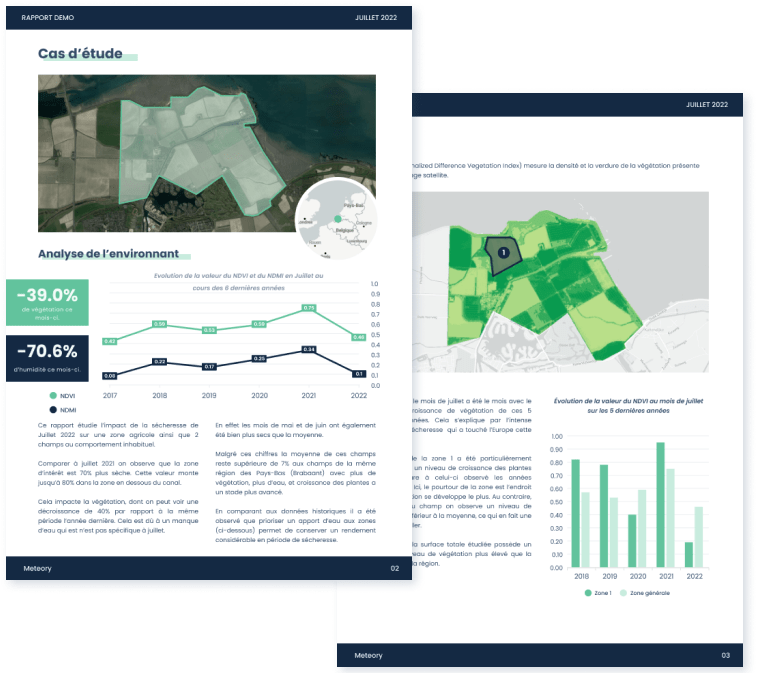
Paper reports
Need a diagnosis on a specific aspect ?request a Meteory report
Do you already have most of the data you need and are just looking to complete your study with one or a few additional indicators ? Then order a Meteory report and take advantage of our expertise on the aspects you’re missing.